

Minority Operated Farms across the Nation
ID
Reflections
Minority principal operators (MPOs) of farms in the United States constitute a relatively small percentage of principal operators overall, but they represent a growing demographic as the number of independent farms continues to decline. In some states MPOs now comprise more than 50% of operators. This brief essay provides insight into the geographic distribution of farms managed by MPOs.
The U.S. Department of Agriculture (USDA) has defined a farm as any place from which $1,000 or more of agricultural products is produced and sold, or normally would have been sold, during a calendar year. According to the USDA, a principal operator is responsible for a farm’s day-to-day operations. This individual also typically considers farming his or her primary occupation. For the purposes of this essay, minority principal operators include five categories of farmers:
- Hispanic, which defines a region of origin, not a person’s race;
- American Indian or Native American;
- Black or African American;
- Asian; and multi-race, persons who identify with more than one race.
- In addition, USDA recognizes Native Hawaiian / Pacific Islanders in Hawaii and Alaska Natives in Alaska.
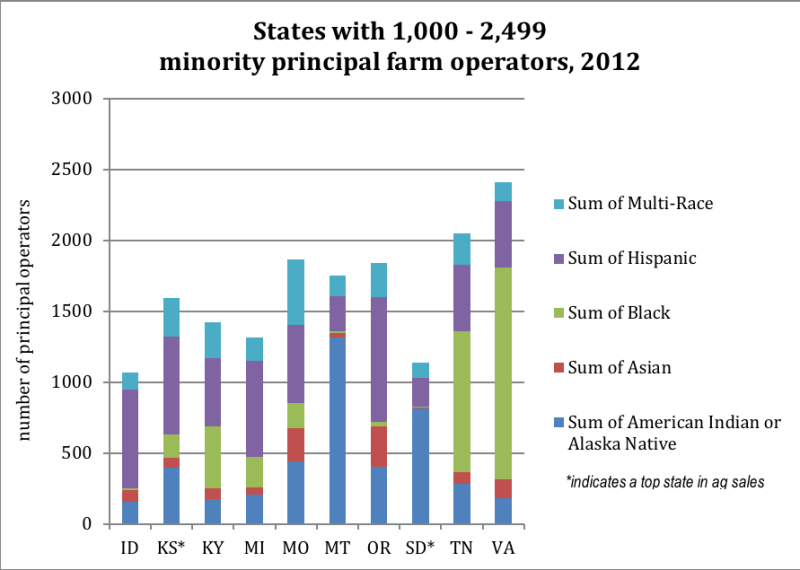
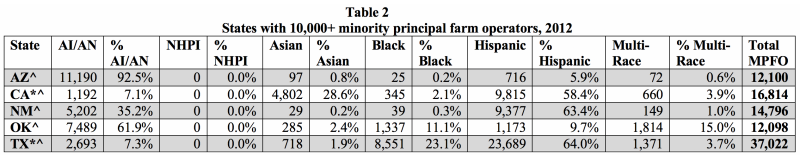
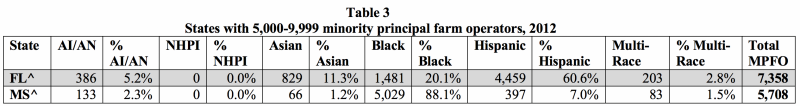
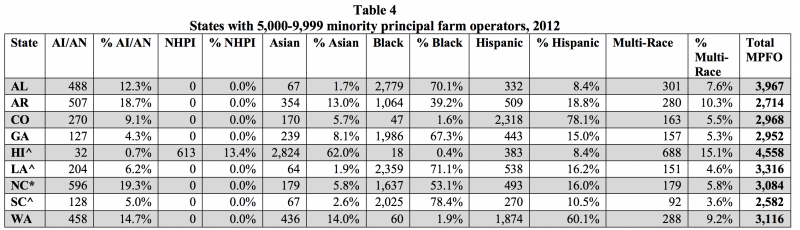
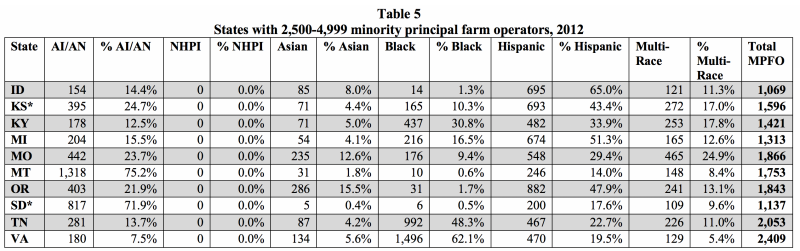
The U.S. agriculture and farming industry now has approximately 2,109,303 principal farm operators and MPOs make up more than 151,891 of that total. MPO’s are a relatively small percentage of principal operators, but, as noted above, they represent a growing demographic, despite the nationwide decline of individuals who consider farming their primary occupation. From 2007 – 2012, the number of principal operators of farms decreased by 4.3%, (NASS Farm Demographics Highlights). Meanwhile, the number of MPOs in each minority group USDA tracks rose during the same period (Figure 1). States located in the Southwest have the highest number of MPOs, followed by Southeastern states (Figure 2). In the Southwest, Hispanic principal operators predominate in California, New Mexico and Texas; Native American MPOs constitute a major presence in Oklahoma, New Mexico and Arizona; Asian MPOs prevail in California; and African American MPOs are much in evidence in Texas. The next largest regional distribution of MPOs is located in the southeast, where African American principal operators constitute a major demographic, although several other states, including Colorado, Washington, Hawaii and Alaska have a sizeable number of MPOs as well. The seven states with more than 5,000 MPOs together are home to 70% of all such farmers (Figures 3-4 and Tables 2 and 3). In addition, MPOs today comprise more than 10% of all principal operator farmers in these states (in the top four instances they make up 19.25% – 62.38% of MPOs in those states). Two of those high percentage MPO states are among the top agriculture producing areas in the nation. California is the top such state with 19% MPOs, while Texas, the third highest agriculture producing state, has 14% MPOs.
Despite the growth of MPOs, the majority of such farms produce sales of less than $10,000 (NASS Farm Demographics Highlights). This over representation in the $10,000 or less sales class translates into lower representation in higher sales classes (Table 1). There is an exception; MPO farms with Asian principal operators “tend to be smaller in size than farms overall, but have higher sales” (NASS AI/AN Highlights). This may be due in part to their production of specialty crops.
This preliminary analysis offers a snapshot of the locations in which MPOs are concentrated across the nation (Figure 2). The next step in my inquiry is to explore why most MPOs produce sales of less than $10,000. Where are Hispanics, African Americans and American Indians who are underrepresented in the higher sales classes, $50,000 to $99,999 and $100,000+, located? What qualities do MPOs in each sales class have that supported their entry into that group? What education, training, knowledge, and/or background do the most successful MPOs have in common? Which states generate the highest MPO farm sales and production? In which states are MPOs well integrated into the food system? What organizations provide assistance to MPOs? Where are federal, state and local resources earmarked for MPOs being directed and why? Are these resources having an impact? What has motivated these MPOs to enter into farming?
Figure 1
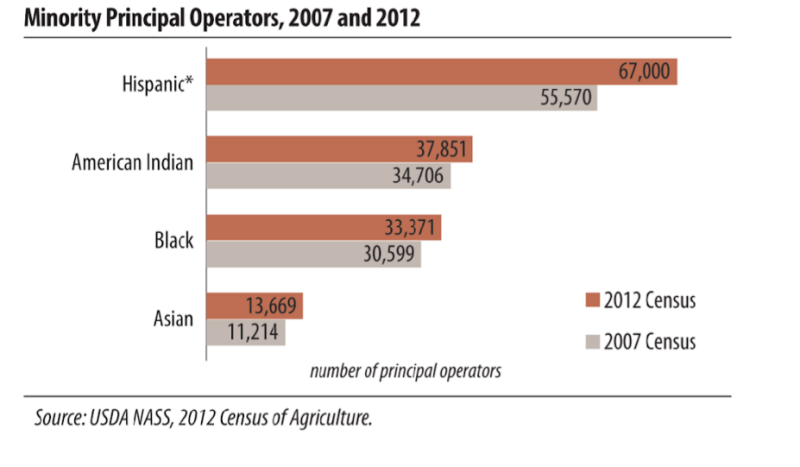
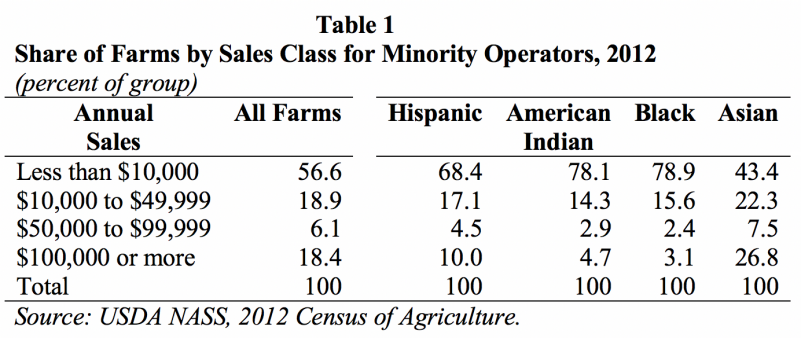
Figure 2
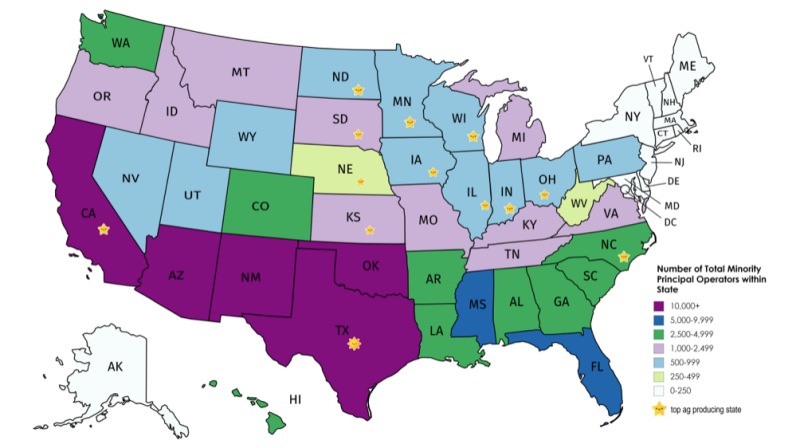
Figure 3 (see Table 2)
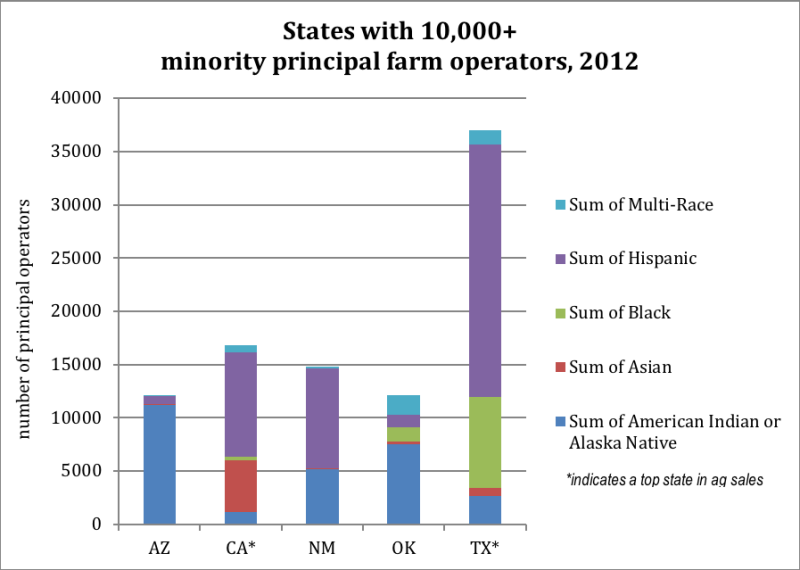
Figure 4 (see Table 3)
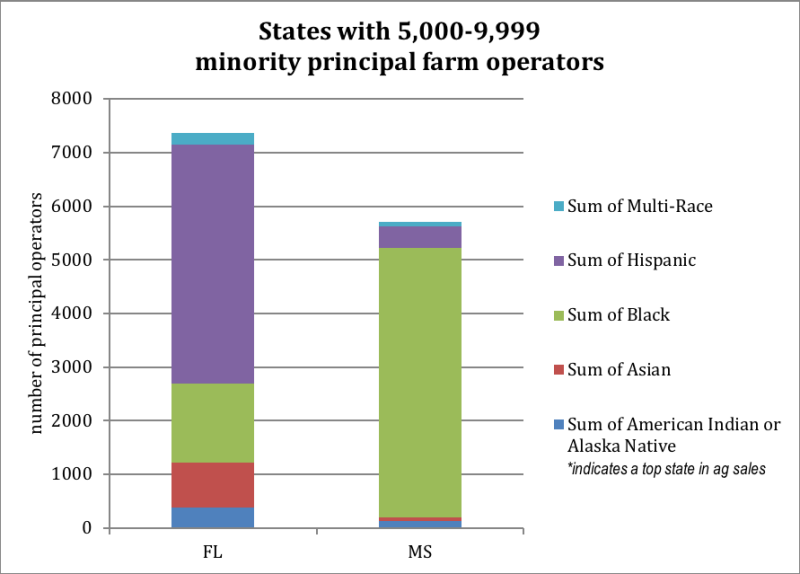
Figure 5 (see Table 4)
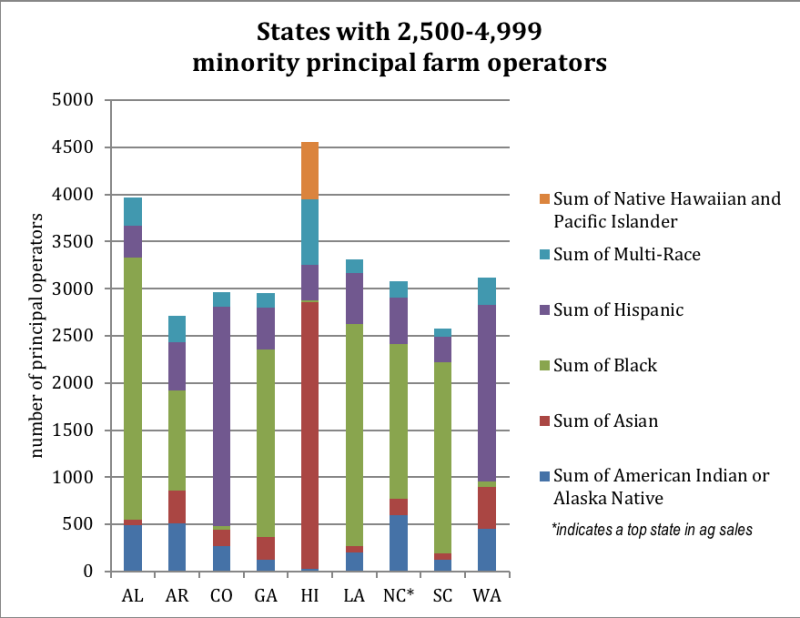
Figure 6 (see Table 5)
*Indicates top ag producing state.
^Indicates MPOs make-up 10% or more of principal operators in the state.
Source: For the above figures and tables: USDA NASS 2012 Census of Agriculture
References
Quick Stats – 2012 Census of Agriculture data, National Agriculture Statistics Service, U.S. Department of Agriculture https://quickstats.nass.usda.gov/
2012 Census of Agriculture, Highlights, Asian Farmers, ACH12-9 2014, https://www.agcensus.usda.gov/Publications/2012/Online_Resources/Highlights/Asian_Farmers/Highlights_Asian_Farmers.pdf
2012 Census of Agriculture, Highlights, Farm Demographics, ACH12-3 May 2014,
2012 Census of Agriculture, Highlights, Farm Economics, ACH12-2 May 2014,
 Lavinia (Vinnie) Panizo is a Masters student in the Center for Public Administration and Policy (CPAP) at Virginia Tech and is pursuing a Master’s in Public Administration with a certificate in Economic Development. She received her bachelor’s degree in Political Science with a minor in Spanish from Virginia Commonwealth University. She also has a teaching credential in Secondary Education with a focus on Social Studies and an emphasis in Cross-Cultural Language Acquisition and Development from California State University Northridge.
Publication Date
October 11, 2018